
Welcome to the ODI
Knowledge for everyone
The ODI helps to unlock the value of open data.
If you want to use our logo, different sizes and types are here: http://theodi.org/brand


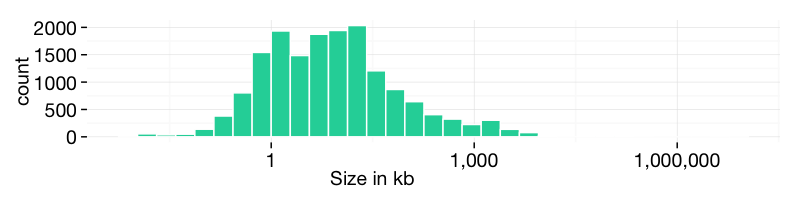
CSV stands for comma-separated values. It is a simple format for tabular data and relatively easy to process. We analysed more than 20,000 links to CSV files on data.gov.uk – only around one third turned out to be machine-readable. A typical CSV is between 1kb-1mb in size and has around eight columns.
Our analysis of the header names of 7,390 machine-readable CSVs suggests that there are clear patterns. The most common type are spend records, usually split by month and type. Other organisations such as the Crown Prosecution Service also release vast amounts of CSVs. If publishers embrace standards for CSV data releases, we see a great potential, e.g. for aggregate analyses or new business services.
In January 2014 we created a file that contains all CSVs published on data.gov.uk. We searched for all CSVs and then grabbed and wrote the metadata we needed into a CSV file.
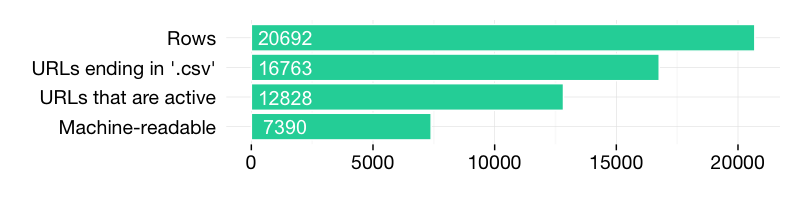
Figure 1 shows how the overall number of 20,692 dwindles to 7,390:
Almost 4,000 URLs are not CSVs and link to other files, web pages or resolve in some download link. Some of them may be valid, but many links don’t work, for example this URL.
Of the URLs that do end in .csv, around 4,000 yield an error. For example, some files that detail the Crossrail Spend 2013 are no longer available.
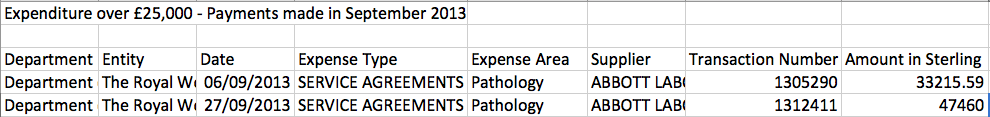
Even if the CSV exists, it loses some of its value if we cannot read it automatically. Standards are hence important. An example of what did not get parsed is below. The first line is the title and the second one is empty (from here).
There are some limitations. For instance, it is hard to replicate the exact numbers as a website may be temporarily offline. We verified “machine-readable” (and excluded ones) in several ways, but it is likely that we still have false positives and vice versa.
The whole analysis and its code is on GitHub.
The vast majority of CSV files is between 1kb and 1mb in size. The largest file on data.gov.uk is at the moment the complete data of the Land Registry Price Paid Data with 3.2gb.
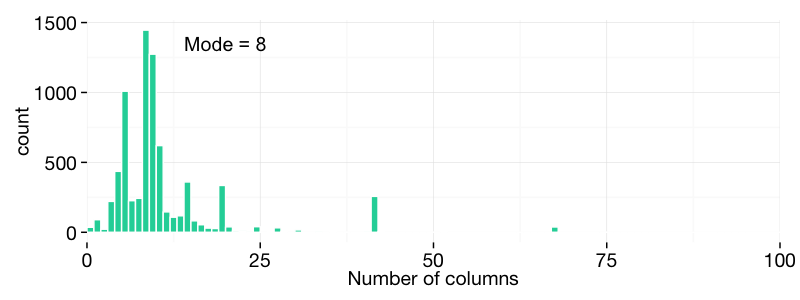
After much experimentation we automatically read 7,390 CSV-files. All of them have header names, of course, that can be analysed. For example, a typical CSV file on data.gov.uk has eight headers, i.e. columns (see figure 3).
There is also a peculiar spike at 41 headers per dataset. Some of the datasets have all the information arranged in only one row with many different columns. The prevalent theme, in this case it seems, are various ways of counting payroll staff.
What are the most popular header names? We had to clean up plenty of names because in its raw format, it is messy data such as “amount”, “ amount”, “AMUONT” etc. After some Open Refine magic, we produced the following rank table.
| Expense Type | 3,144 |
| Entity | 3,039 |
| Expense Area | 3,029 |
| Supplier | 2,889 |
| Date | 2,820 |
| Transaction Number | 2,791 |
| Amount | 2,734 |
| Department Family | 2,498 |
| VAT Registration Number | 916 |
| Convictions Percentage | 836 |
The headers may not be representative overall because it only features the machine-readable CSVs. They are frequency counts which also implies that departments that release similar data in individual CSVs (e.g. for each month) are overrepresented. Be that as it may, the header ranking shows how common certain data types are.
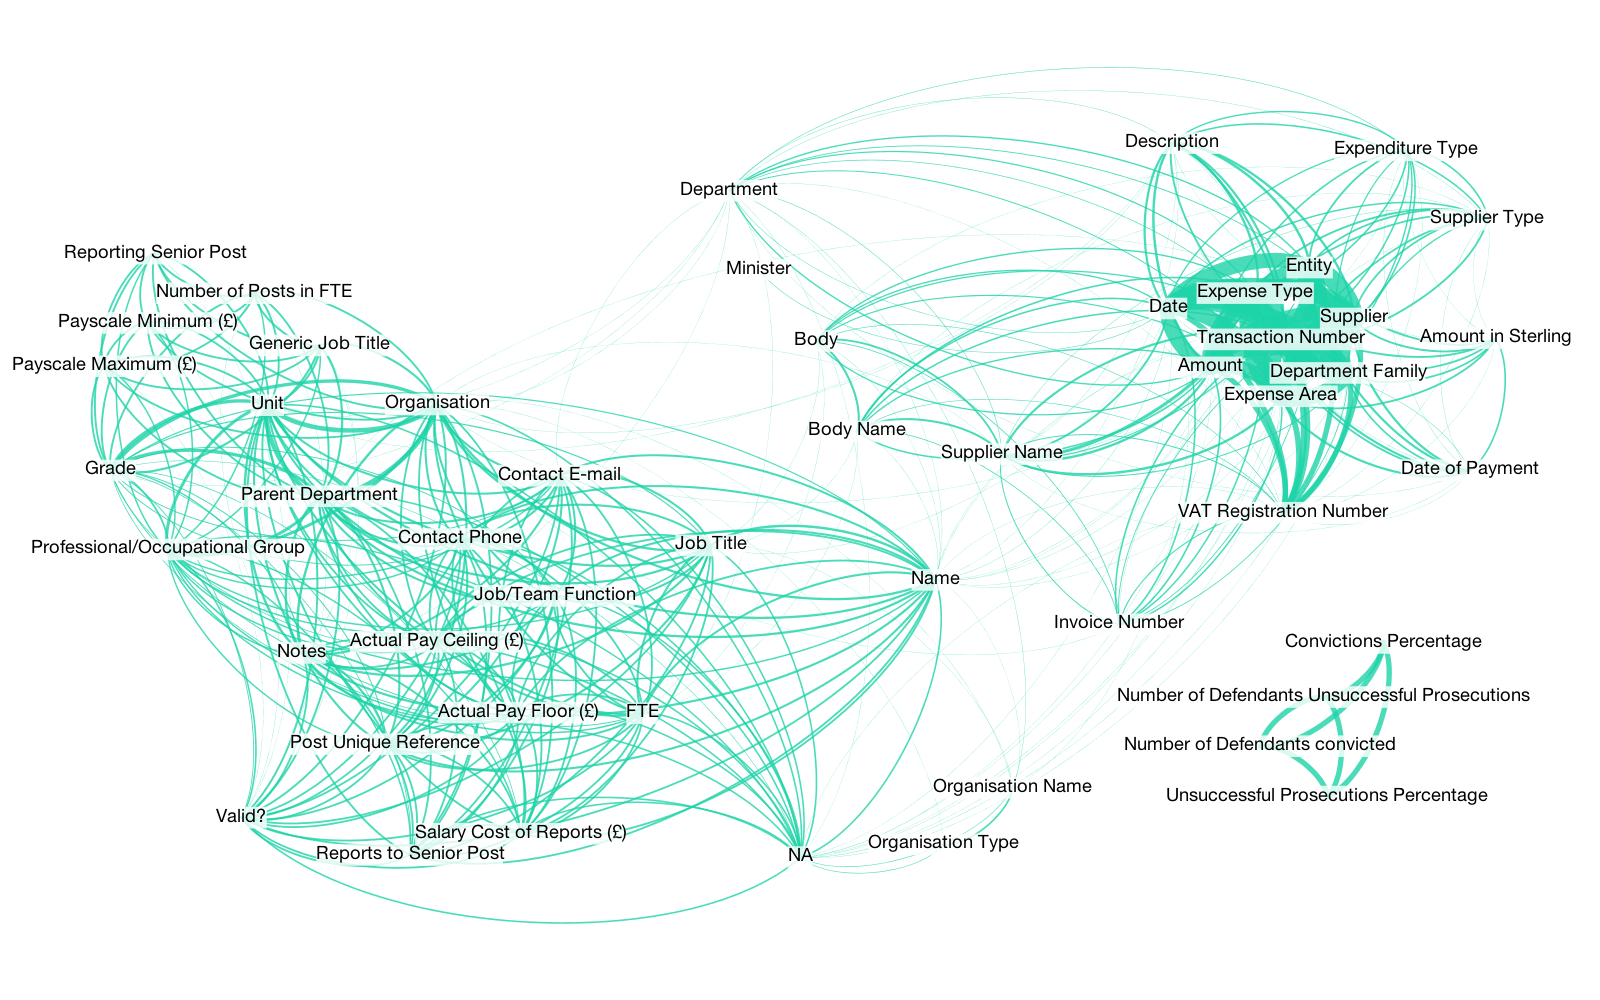
We took the 50 most popular header names and calculated how often they each appear together. The lines’ thickness stands for the frequency of their co-occurence. For example, as we would expect, Payscale Minimum and Payscale Maximum are next to each other. A generic header name such as Unit appears in many files and has therefore stronger links to various others.
The most common cluster is around Expense Type because many files document government spending. A typical “Spend over £25,000” CSV is very likely to have similar headers as listed in the previous table.
We also see an independent cluster around prosecutions. For example, the Crown Prosecution Service releases a lot of individual CSVs, which increases how many times they appear in our header analysis.
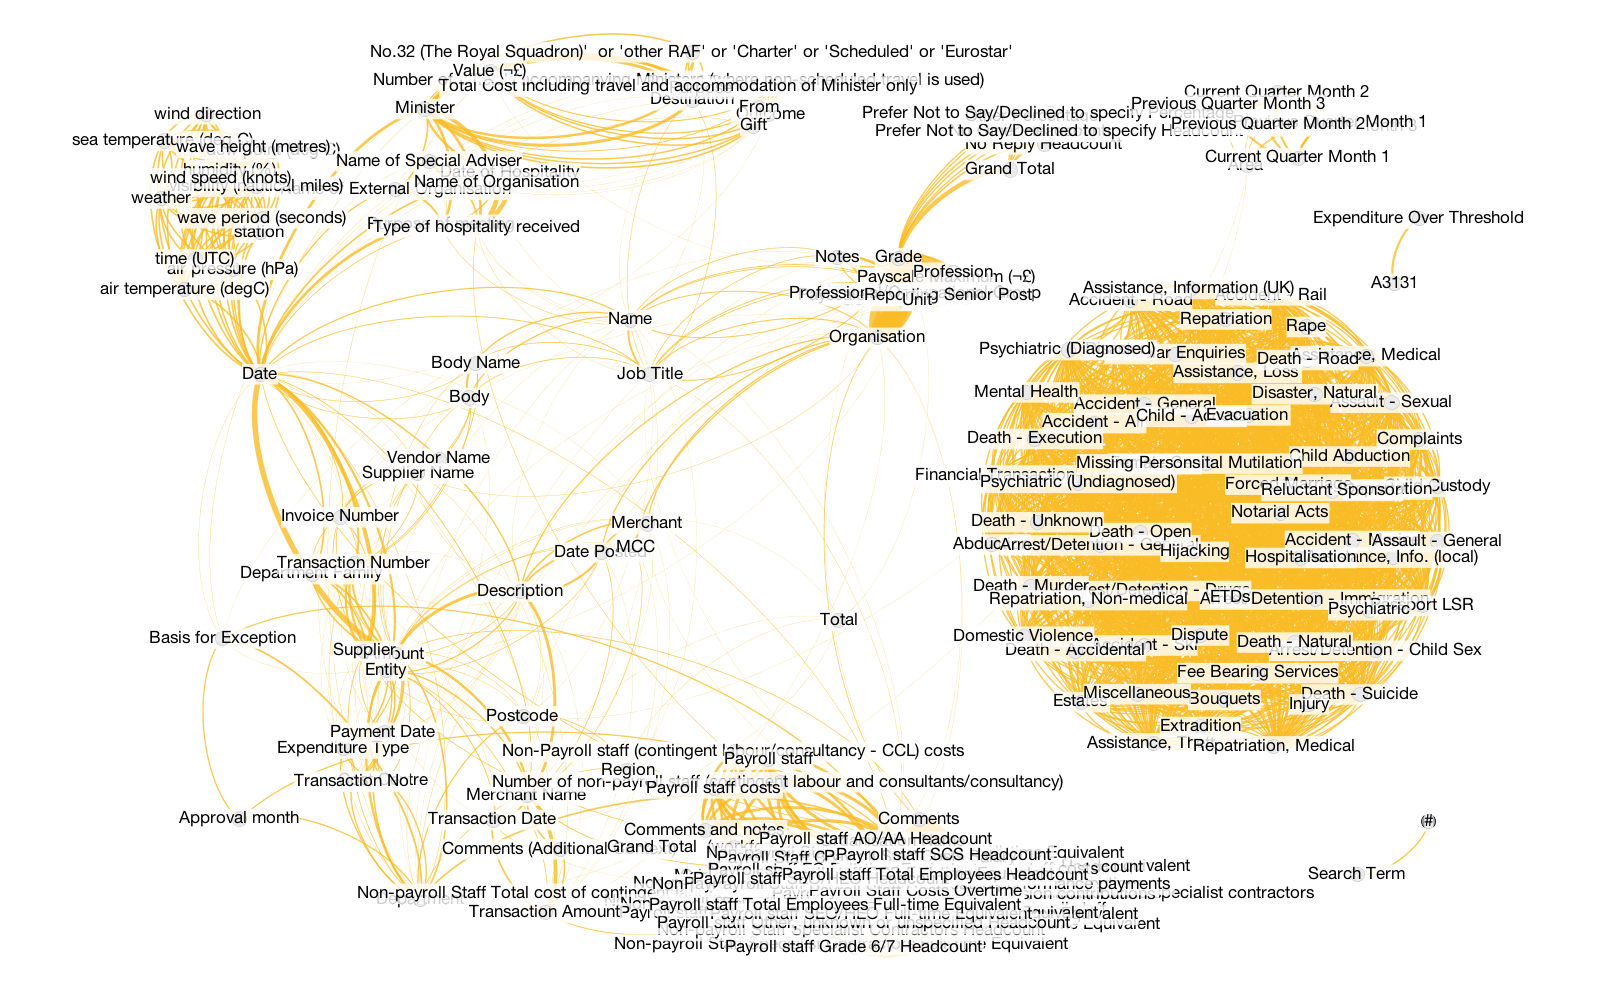
Figure 5 shows the co-occurrence of headers excluding popular datasets. For example, CSVs with Expense Type no longer appear. Here the 200 most popular header names reveal quite a tangle. The large, overplotted area on the bottom are CSV headers, among others, from the BIS Workforce Management Information.
The big cluster on the right, dubbed the “Death Star”, comes from one series of CSVs. The Foreign Office Consular publishes “data on assistance provided to British nationals worldwide this includes numbers of incidents handled by UK consulates overseas, including hospitalisations, deaths, detentions, with geographical location”.
A similar cluster appears on the top left published by the Metoffice. It includes the latest 24 hours marine data for observed weather. Both exemplify why some headers are more related than others: a publisher may release many almost identical files split by time or geography.
We appreciate that more and more people recognise CSV as a desirable format for sharing data on the web. However, publishing any tabular data simply with a .csv extension will not bring as much further. The key is to follow a minimal standard. Tools for doing so are emerging, for instance the ODI’s CSV validator. As Jeni wrote, 2014 may turn out to be the Year of the CSV.
Our analysis is far from exhaustive relative to the open data ecosystem; it only looks at data.gov.uk. Even there we have to acknowledge certain limitations such as incorrect headers or temporarily unavailable URLs. What it shows us, however, is that few publishers follow leading practice yet.
By making access and aggregation of data via CSV easier, we enable a huge potential. For example, only an automated analysis may be able to look at the spending across all government departments and bring the often proclaimed transparency. Companies may use CSVs to integrate them into their dashboards or to build services. Even non-technical citizens may be able to use the data more easily. Many user-friendly tools such as Datawrapper have CSV features built-in.
Let’s aim for a world with less data munging.